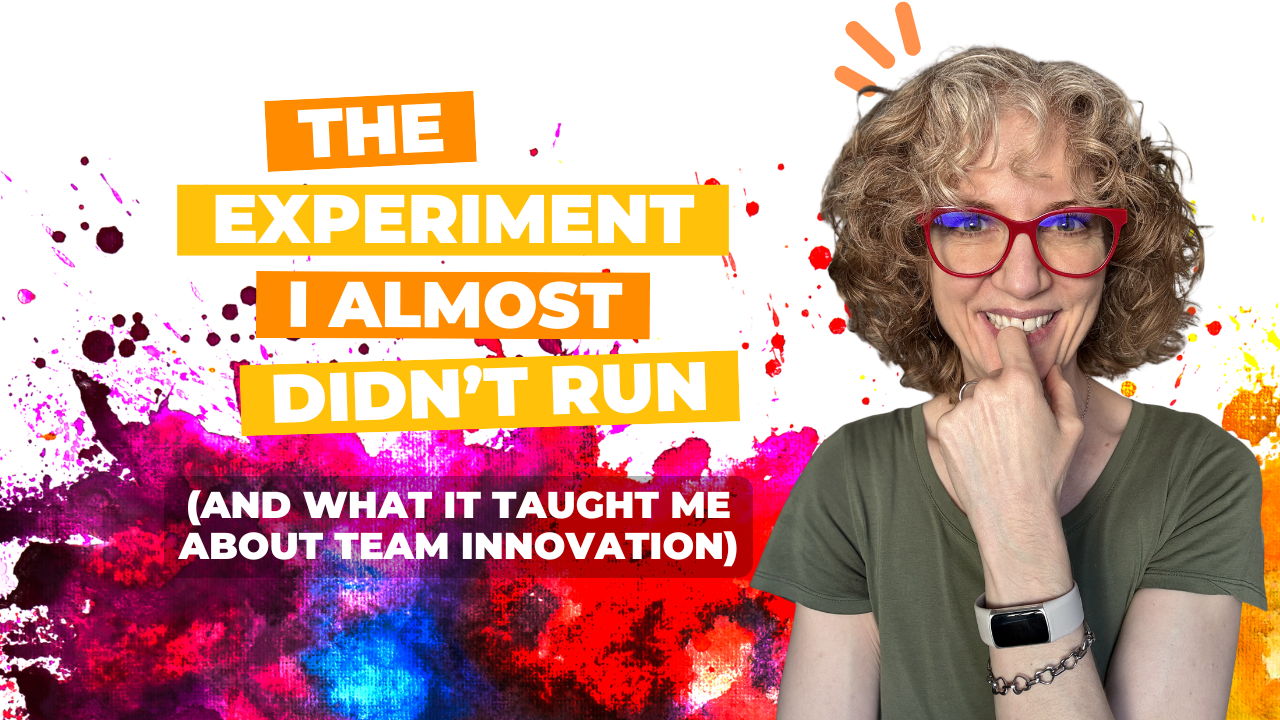
Your team doesn’t need a creativity transplant. They need different conditions. Hey there, innovation champions!
The Question That Changes Everything
Here’s a pattern I’ve watched play out in organization after organization, across industries, team sizes, and job functions.
A leader decides it’s time to “get more creative.” They send their team to a workshop. Maybe they bring in a speaker. People leave inspired. Two weeks later, nothing has changed.
The leader concludes: “Our people just aren’t creative types.”
But that’s almost never what actually happened.
What I See When I’m In the Room
After years of working with teams at organizations like Google, Meta, and Salesforce — and with hundreds of project managers, HR leaders, and engineers at conferences and workshops — I’ve noticed something consistent.
The people who get labeled “not creative” almost always have great ideas. Sharp ones. Unexpected ones.
They just never say them out loud.
Or they say them once, get a lukewarm response, and never say them again.
Or they keep waiting until the idea is fully formed, bulletproof, impossible to criticize — and by then the moment has passed.
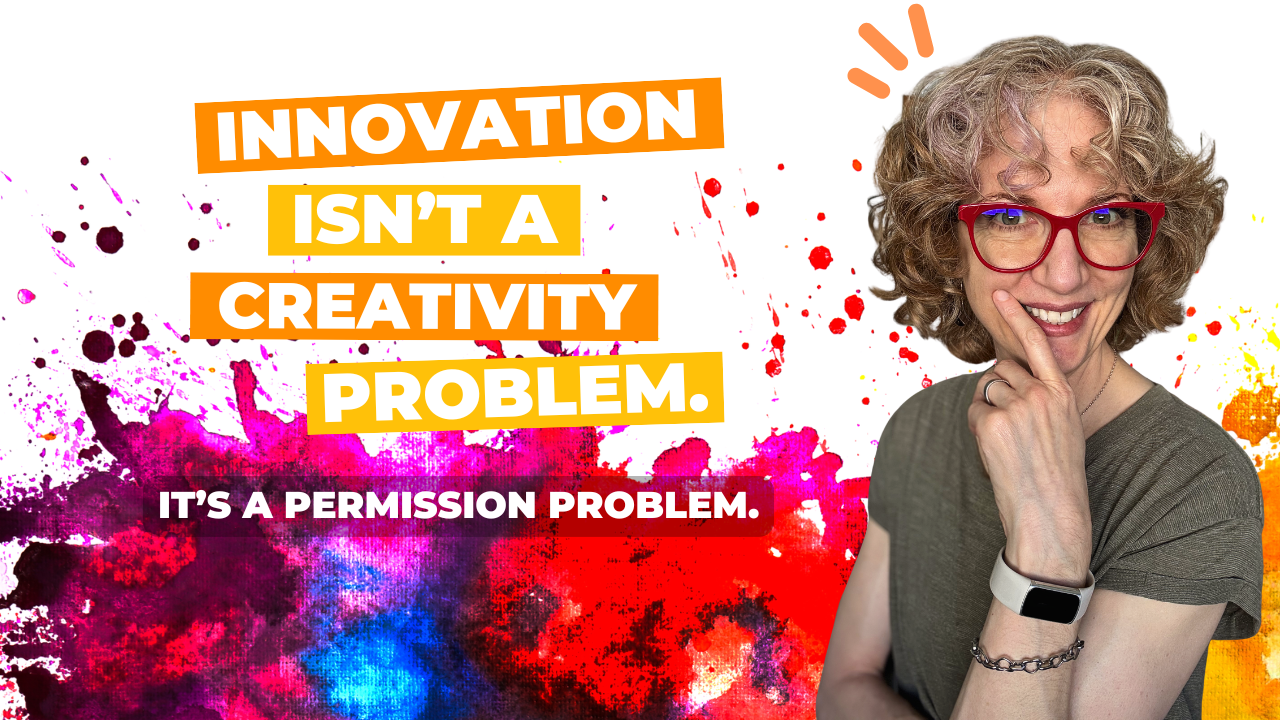
What looks like a creativity gap is actually something else entirely.
The Real Bottleneck
Back in January, I wrote about my friend Sara — a fellow calligrapher who made three pieces before breakfast while the rest of us showed up to our monthly group meeting empty-handed.
Sara wasn’t more talented than us. She didn’t have more time.
The one thing she had that most of us didn’t? Permission. Specifically: permission she’d granted herself to make things that weren’t perfect.
That story was about prolificness. But the same principle runs even deeper in organizational settings — because in organizations, the permission problem isn’t just internal. It’s structural.
Your team members aren’t just battling their own perfectionism.
They’re reading the room. Watching what happens when someone raises an unconventional idea. Noticing whether “we welcome all ideas” is actually true, or just something that gets said in all-hands meetings.
They’re making a calculation, dozens of times a day, that goes something like: Is it safe to say this out loud?
And in most organizations — even healthy ones — the answer is quietly, persistently: probably not.
Why Analytical Teams Feel This Most Acutely
This dynamic hits hardest in analytical environments: engineering, project management, finance, HR.
In these cultures, precision is a virtue. Expertise is currency. Being “right” carries real weight.
Over time, people internalize an unspoken rule: Don’t raise your hand unless you’re sure.
It’s not a character flaw. It’s rational adaptation to the environment.
But the unintended consequence is that experimentation slows to a crawl. Ideas get pre-filtered before they ever reach the room. Innovation doesn’t disappear — it just gets buried under layers of self-censorship.
And leaders are left wondering why “we need more innovation” keeps appearing in their engagement surveys, year after year.
The Shift That Looks Small But Isn’t
Here’s what I’ve learned from watching this dynamic change in real time:
The breakthrough rarely comes from telling people to “be more creative.”
It comes from changing the conditions — making it structurally, visibly, unmistakably safe to share half-formed thinking.
That’s what the first phase of my Create the Impossible™ framework is designed to do. Play Hard isn’t about games for the sake of games. It’s about creating the conditions where unfinished ideas can survive long enough to become something.
When leaders model this — when they share their own half-baked thinking, celebrate intelligent failures, and explicitly reward experimentation over perfection — something shifts.
Not in months. Usually in minutes. What “Permission” Actually Looks Like in Practice
Permission isn’t a poster on the wall that says “Fail Fast.”
It’s the leader who says, in a meeting, “I have no idea if this is right, but here’s what I’m thinking” — and means it.
It’s the retrospective that asks “What did we learn?” before “What went wrong?”
It’s the brainstorm where the first rule isn’t “no bad ideas” (everyone’s heard that before and no one believes it) — but where the leader visibly, enthusiastically builds on the worst idea in the room.
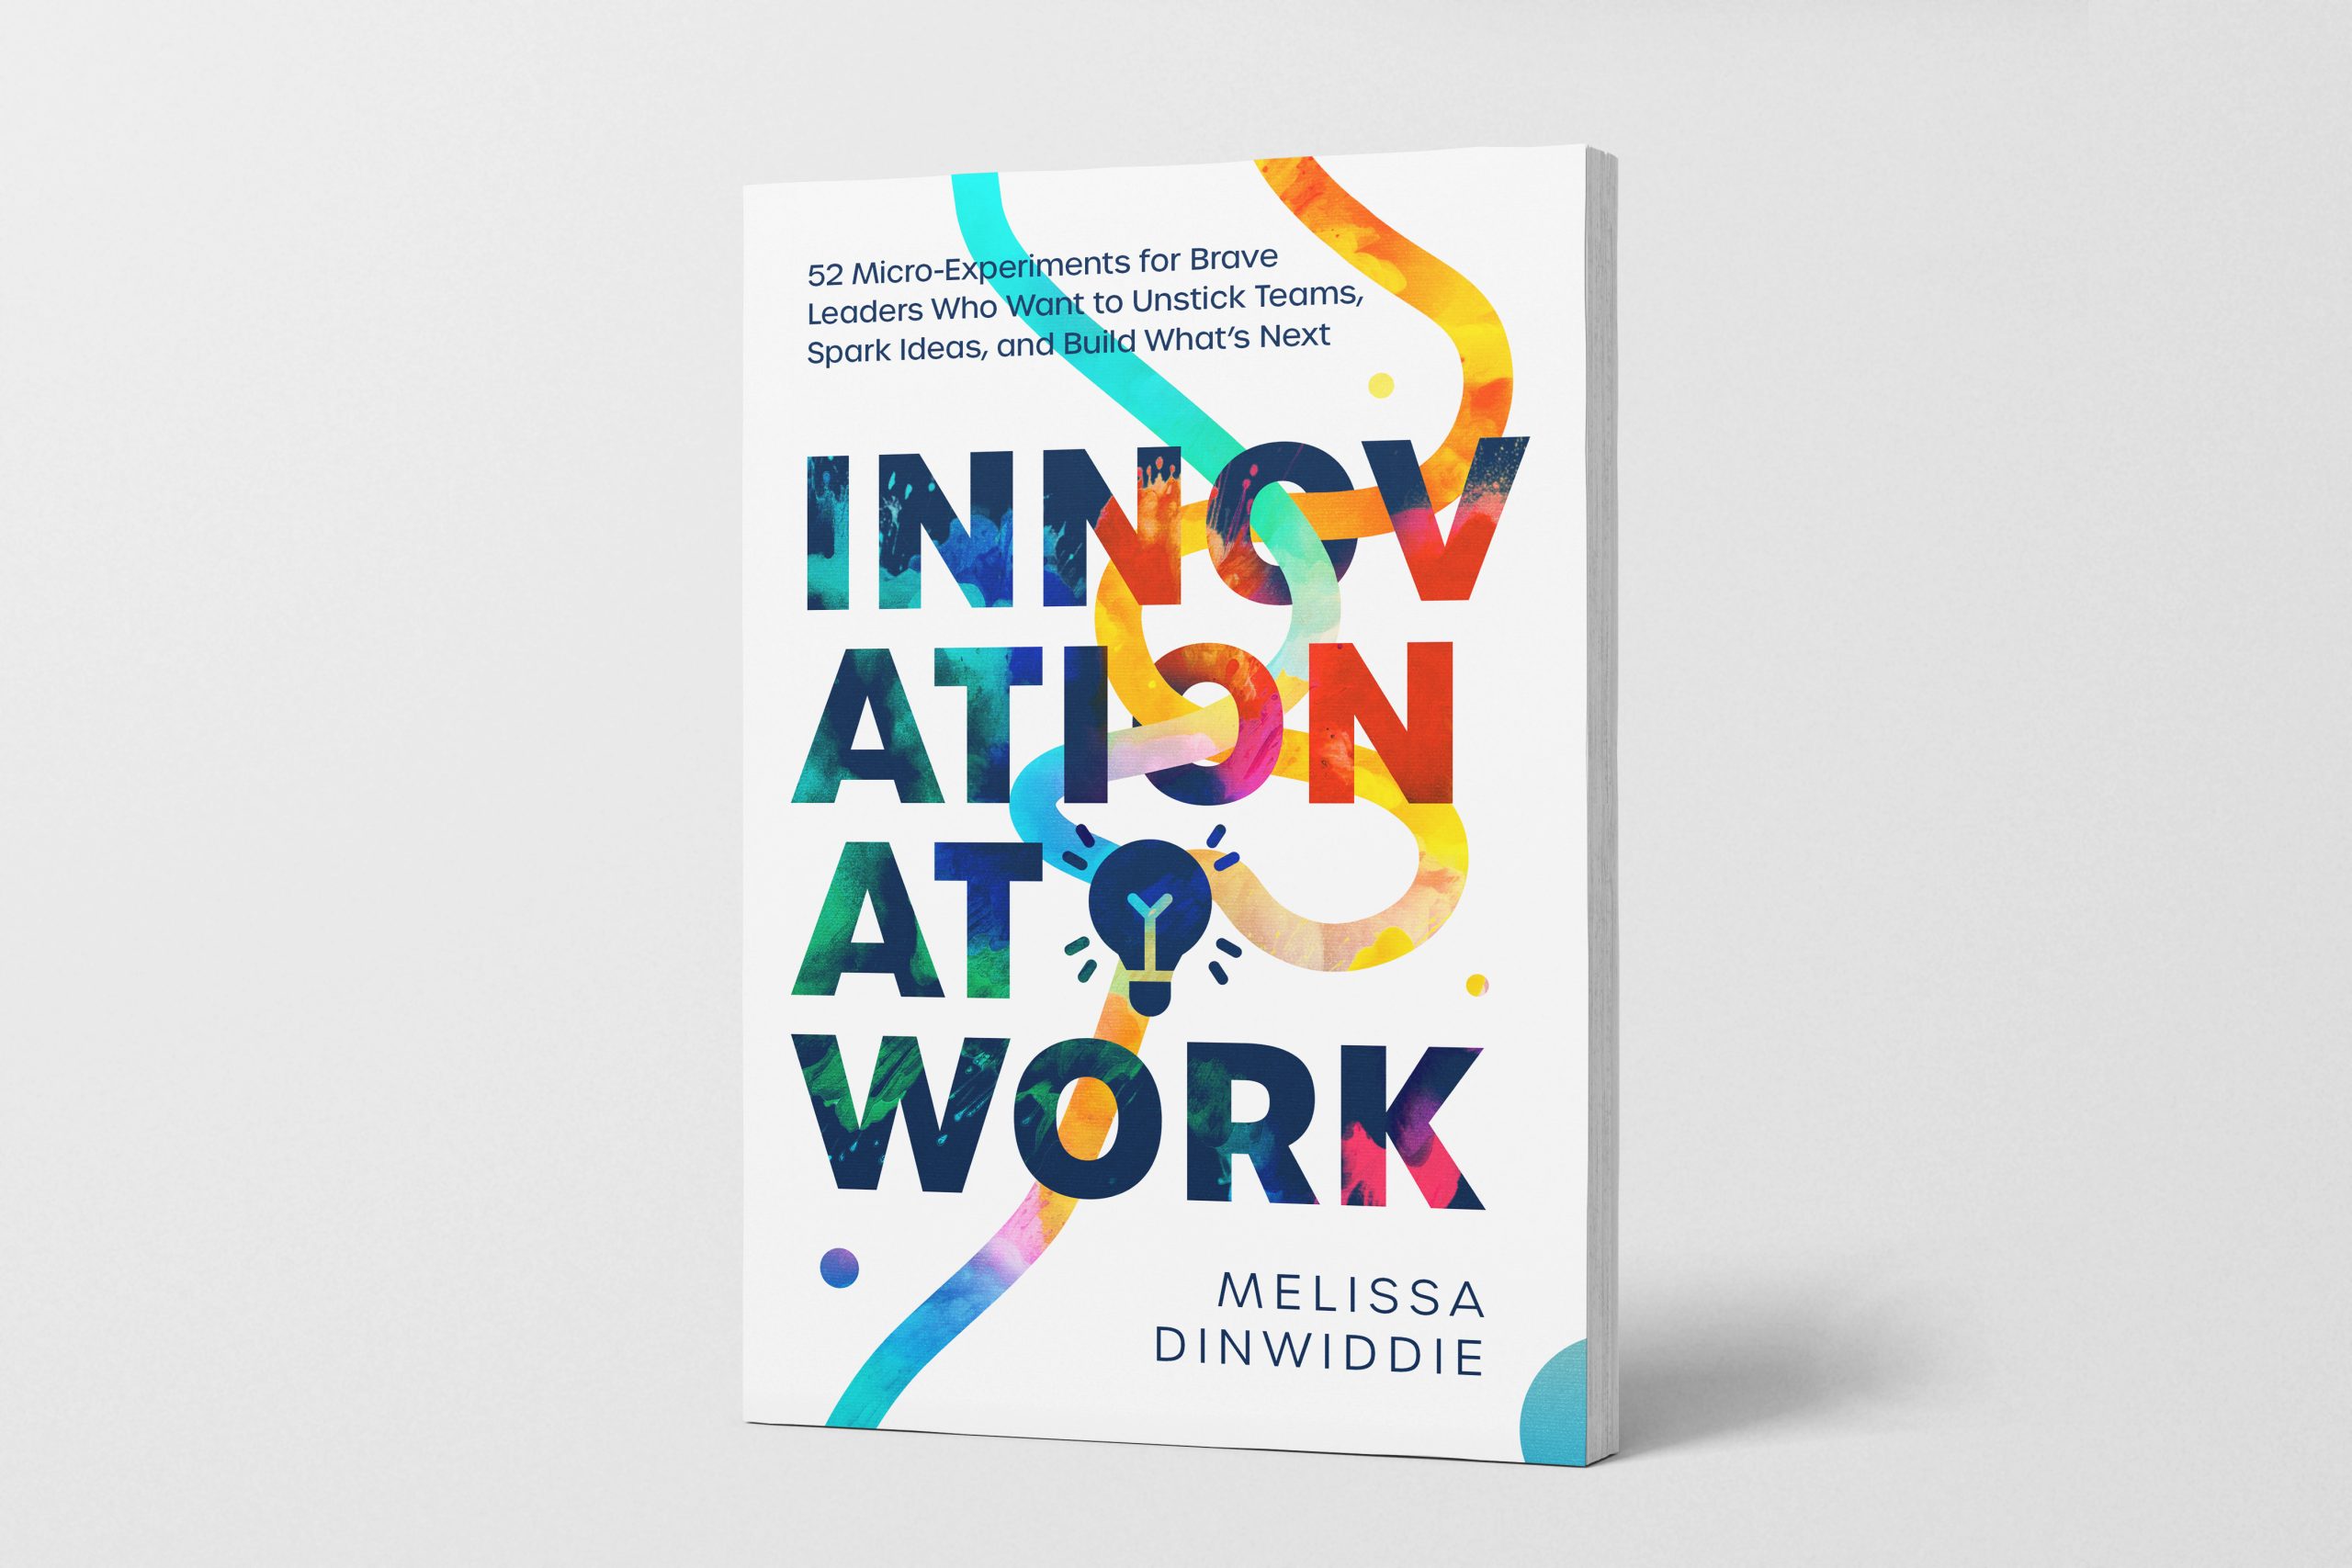
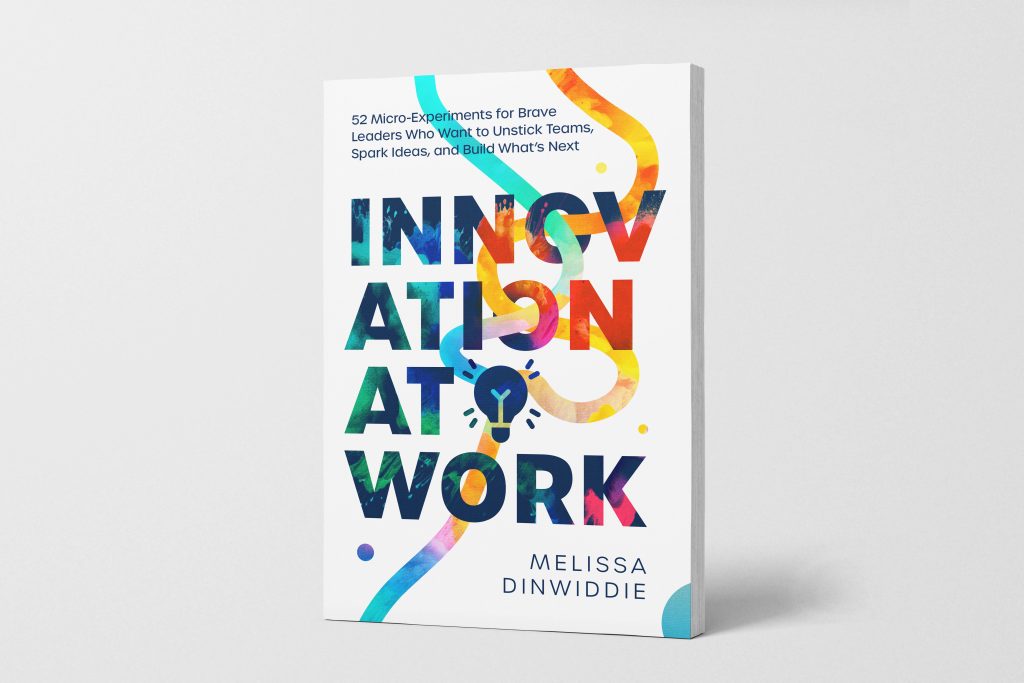
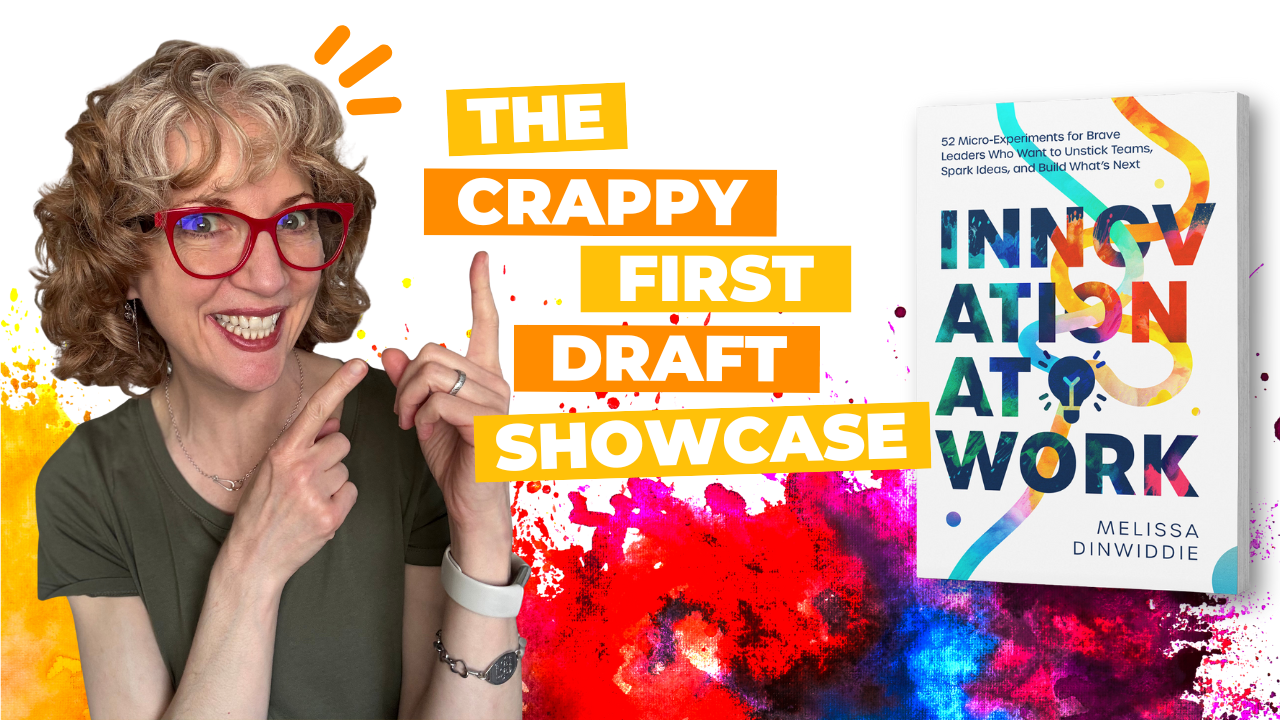
In my book, Innovation at Work, I included an experiment called the Permission Slip Protocol — one of the simplest and most consistently powerful exercises in the whole collection. Each person writes themselves a permission slip for one specific behavior they’ve been hesitant to try: “Permission to share half-formed ideas in meetings.” “Permission to question project assumptions.” “Permission to suggest process changes.”
Then they share it with the team and get explicit verbal permission from their colleagues.
It takes eight minutes.
The look on people’s faces when they hear “Yes, absolutely — please do that” from their peers is something I never get tired of seeing.
The Question Worth Asking
If you’re working on an innovation initiative — or wondering why the last one didn’t stick — it might be worth asking a different question.
Not: How do we get our people to be more creative?
But: What are the conditions that currently make it unsafe to experiment? And what would it take to change them?
The creativity is already there. It’s waiting for permission to show up.
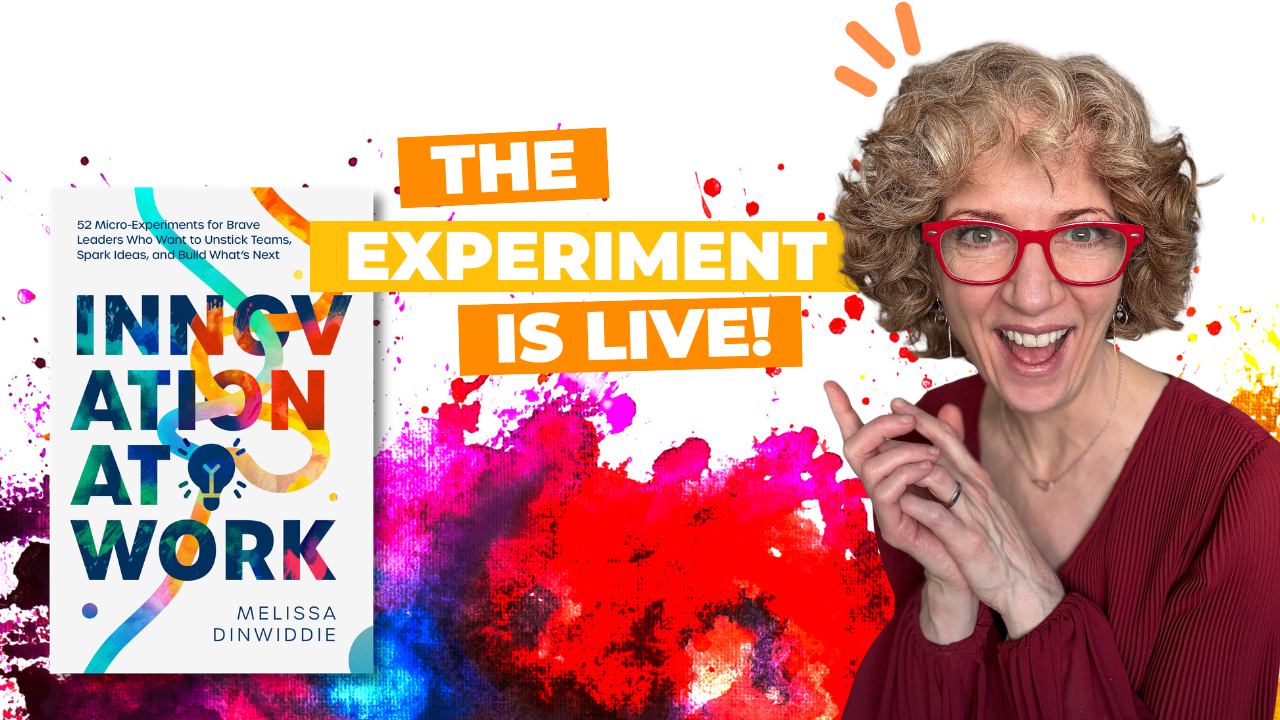
If you’re curious what that shift could look like for your team, I’d love to talk. You can book a complimentary 30-minute Innovation Strategy Session — no pitch, just a real conversation about what’s getting in the way.
Or just click here and tell me: what’s one idea your team has been sitting on that nobody’s said out loud yet? I read every response.